Comprehensive Guide to Technical Analysis
- timonleuzinger
- Jul 21, 2024
- 4 min read
Updated: Jul 25, 2024
Comprehensive Guide to Technical Analysis
Introduction to Technical Analysis Technical analysis is a method used to evaluate and predict the future price movements of financial assets based on historical price and volume data. Unlike fundamental analysis, which focuses on a company's financial health and economic factors, technical analysis is solely concerned with price action and market trends.
1. Basics of Technical Analysis
1.1 What is Technical Analysis?
Definition: Technical analysis involves studying past market data, primarily price and volume, to forecast future price movements.
Purpose: To identify trading opportunities by analyzing statistical trends from trading activity.
1.2 Key Principles of Technical Analysis
Market Discounts Everything: All available information is reflected in the current price.
Price Moves in Trends: Prices tend to move in identifiable trends (up, down, or sideways).
History Tends to Repeat Itself: Patterns in price movements tend to repeat over time due to market psychology.
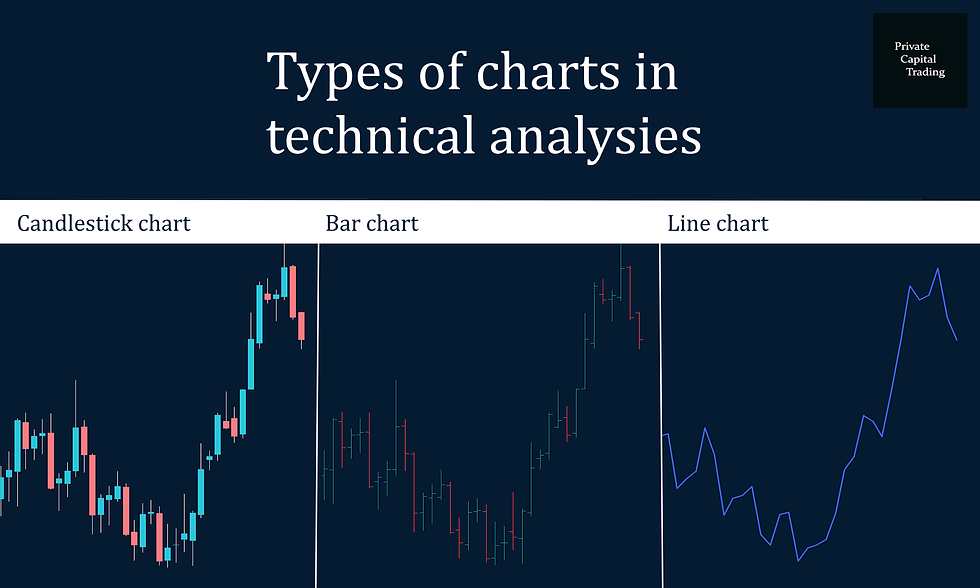
1.3 Types of Charts
Line Chart: A simple chart that connects closing prices over a specified period.
Bar Chart: Displays opening, closing, high, and low prices for each period.
Candlestick Chart: Similar to bar charts but with a more visual representation using candlesticks.
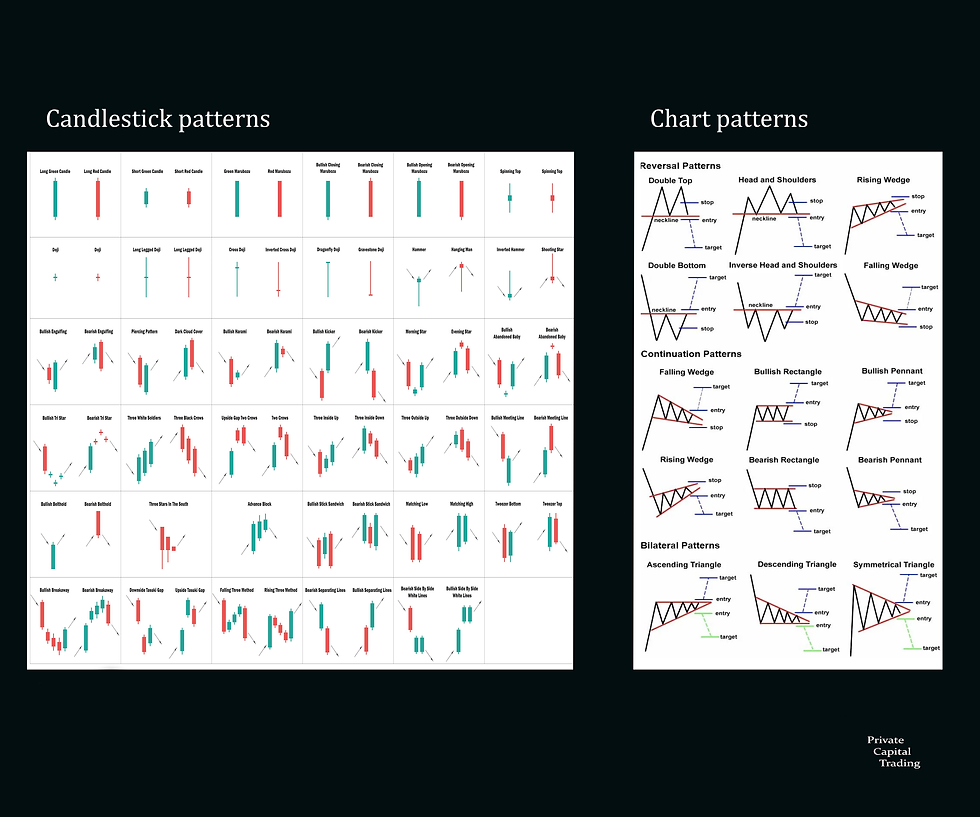
2. Chart Patterns
2.1 Reversal Patterns
Head and Shoulders: Indicates a reversal from a bullish to a bearish trend.
Double Top and Double Bottom: Signifies potential reversals at key levels of resistance and support.
Triple Top and Triple Bottom: Similar to double patterns but with three peaks or troughs.
2.2 Continuation Patterns
Triangles (Symmetrical, Ascending, Descending): Suggest a continuation of the current trend after a consolidation period.
Flags and Pennants: Short-term continuation patterns that indicate a brief consolidation before the trend resumes.
Rectangles: Horizontal price movement indicating a pause in the trend before continuation.
2.3 Candlestick Patterns
Doji: Indicates indecision in the market; potential reversal.
Hammer and Hanging Man: Bullish and bearish reversal patterns, respectively.
Engulfing Patterns: Strong reversal signals with a large body engulfing the previous candle.
Morning Star and Evening Star: Three-candle patterns signaling potential reversals.
3. Technical Indicators
3.1 Trend Indicators
Moving Averages (MA): Smooth out price data to identify trends.
Simple Moving Average (SMA): Average of a set number of past prices.
Exponential Moving Average (EMA): Gives more weight to recent prices.
Moving Average Convergence Divergence (MACD): Shows the relationship between two moving averages.
3.2 Momentum Indicators
Relative Strength Index (RSI): Measures the speed and change of price movements.
Stochastic Oscillator: Compares a particular closing price to a range of its prices over a period.
Average Directional Index (ADX): Indicates the strength of a trend.
3.3 Volatility Indicators
Bollinger Bands: Consist of a moving average with upper and lower bands based on standard deviations.
Average True Range (ATR): Measures market volatility by decomposing the entire range of an asset price.
3.4 Volume Indicators
On-Balance Volume (OBV): Measures buying and selling pressure.
Chaikin Money Flow (CMF): Combines price and volume to show the amount of money flowing in and out of a security.
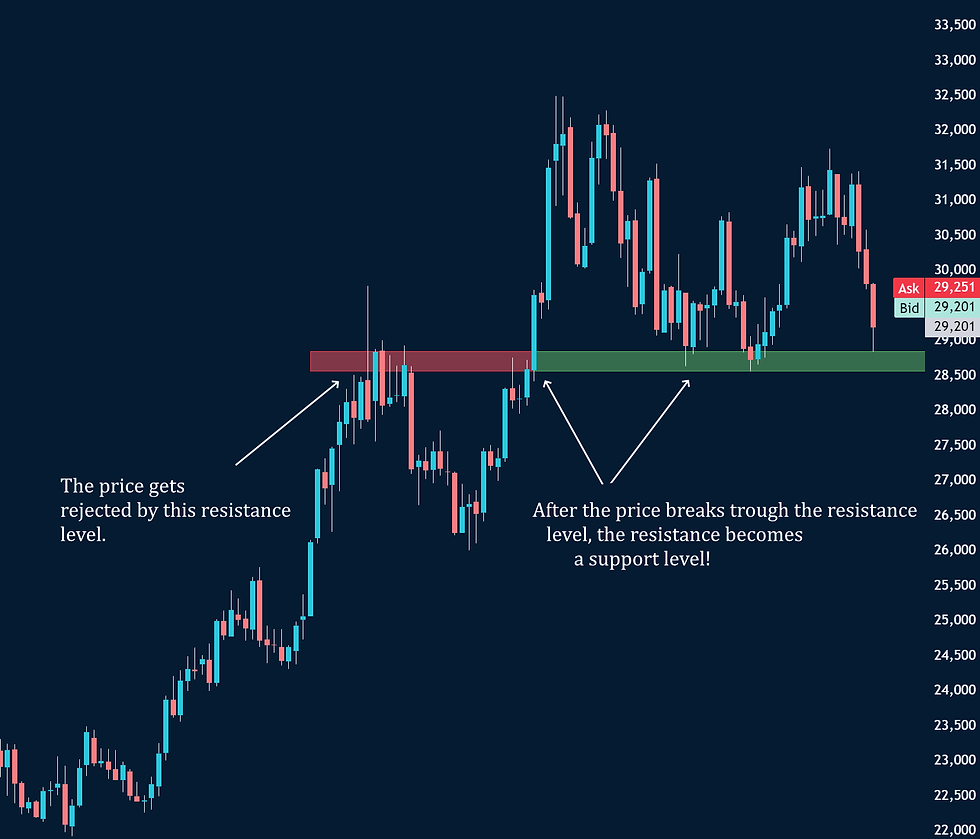
4. Support and Resistance
4.1 Identifying Support and Resistance Levels
Support: A price level where a downtrend can be expected to pause due to a concentration of demand.
Resistance: A price level where an uptrend can be expected to pause due to a concentration of supply.
4.2 Psychological Support and Resistance
Round Numbers: Levels ending in 0 or 5 that often act as psychological barriers.
Previous Highs and Lows: Historical price levels that can act as future support or resistance.
4.3 Trendlines
Drawing Trendlines: Connect at least two points to define a trend.
Types of Trendlines: Uptrend lines (support), downtrend lines (resistance), and horizontal lines (consolidation).
5. Trading Strategies
5.1 Trend-Following Strategies
Moving Average Crossover: Buy when a short-term MA crosses above a long-term MA; sell when it crosses below.
Trendline Breakouts: Enter trades when the price breaks a well-established trendline.
5.2 Counter-Trend Strategies
Reversal Patterns: Trade reversals at key levels using patterns like head and shoulders or double tops/bottoms.
Divergence: Use indicators like RSI or MACD to identify divergences where price moves in the opposite direction of the indicator.
5.3 Range-Bound Strategies
Support and Resistance Trading: Buy at support and sell at resistance within a range.
Bollinger Band Strategies: Use the bands to identify overbought or oversold conditions in a range-bound market.
6. Risk Management
6.1 Setting Stop-Loss and Take-Profit Levels
Stop-Loss Orders: Automatically close a trade at a predetermined loss level to protect capital.
Take-Profit Orders: Automatically close a trade at a predetermined profit level to lock in gains.
6.2 Position Sizing
Risk Per Trade: Determine how much of your capital you are willing to risk on each trade (commonly 1-2%).
Leverage: Use leverage cautiously to avoid magnifying losses.
6.3 Diversification
Portfolio Diversification: Spread investments across various assets to reduce risk.
Strategy Diversification: Use a mix of trading strategies to mitigate the impact of a single strategy's failure.
7. Developing a Trading Plan
7.1 Setting Goals and Objectives
Define what you aim to achieve with your trading (e.g., income, capital growth).
Set realistic, measurable, and time-bound trading goals.
7.2 Creating and Testing a Strategy
Backtesting: Test your strategy on historical data to evaluate its performance.
Forward Testing: Use a demo account to test your strategy in real-time without risking real money.
7.3 Reviewing and Refining Your Plan
Record Keeping: Maintain a trading journal to track trades, performance, and emotions.
Continuous Improvement: Regularly review and adjust your trading plan based on performance and changing market conditions.
8. Tools and Resources for Technical Analysis
8.1 Trading Platforms
MetaTrader 4/5: Popular trading platforms with extensive technical analysis tools.
TradingView: Web-based platform with advanced charting capabilities.
8.2 Books and Courses
Books: "Technical Analysis of the Financial Markets" by John Murphy, "A Complete Guide to Technical Trading Tactics" by John Person.
Social Media: Follow experienced traders and analysts on youtube and financial blogs.
Conclusion
Technical analysis is a powerful tool for traders seeking to capitalize on market movements. By understanding chart patterns, indicators, and trading strategies, and by effectively managing risk, traders can improve their chances of success in the financial markets. Continuous learning and adaptation are crucial, as markets evolve and new tools and techniques emerge. if you wanna
If you want to start your Trading journey and earn your first money, i recommend our favourite broker blackbullmarkets: https://go.blackbull.com/visit/?bta=41739&brand=blackbull
The best tool for charting and trading in our opinion is tradingview:
Happy trading!


Comments